ANALYSIS AND STATISTICS

ANALYSIS AND STATISTICS

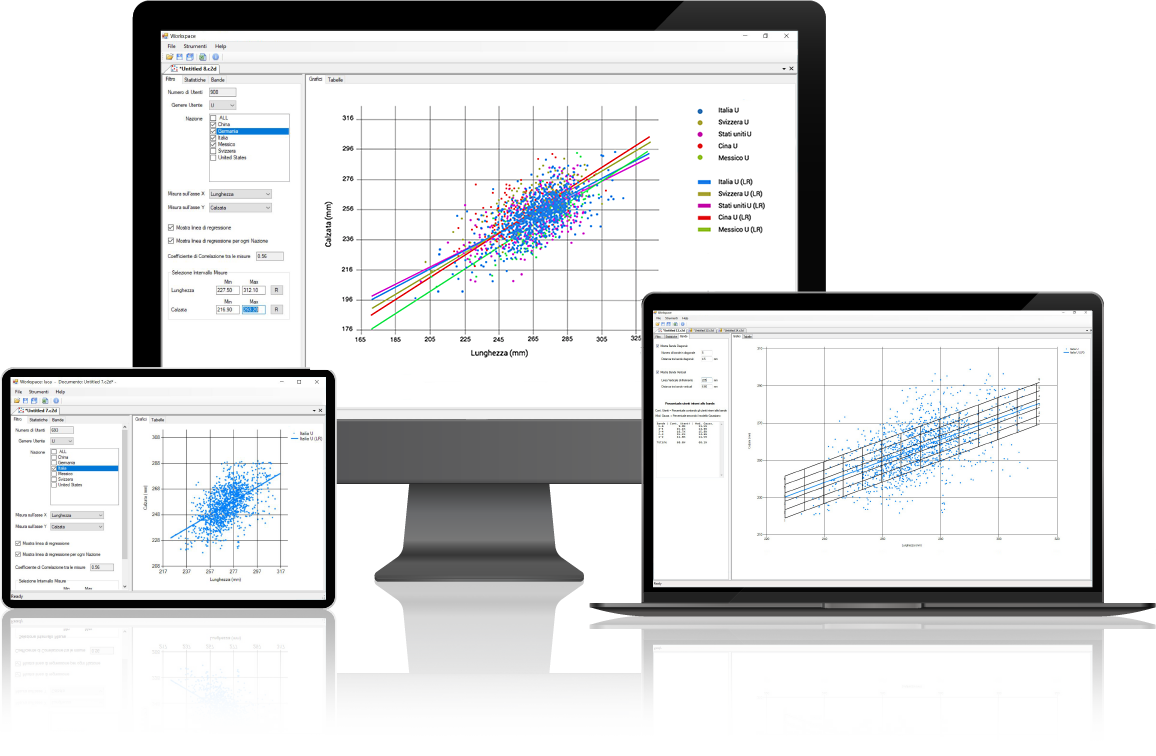
Getting data and statistics on foot morphology has never been easier! Try our powerful analysis and statistics software, and optimize your production.

RS-FEETMEASURES

Currently, the size systems do not take into account the geographical differences, offering shoes that can adapt to any type of foot but are not optimized for anyone. Our RS-Feet Measures software is born to face the problem, allowing the analysis of the measures and characteristics of the human foot, in relation to geographical and demographic parameters.

Despite the place in which the footwear production takes place, every shoe or last cheese factory has the need to manage with absolute certainty the inner volume and the size range the shoes they produce.

With RS-FeetMeasures we make it possible to develop sizes that mirror the morphology of the foot based on the geographical area and ethnicity, allowing the supply chain to get to know and understand the consumers’s feet all over the world and produce shoes that are truly faithful to the collected data.

Our software uses the most advanced automatic self-learning algorithms, constantly updating itself with the increase of data entered by our customers.

Once downloaded from the RS portal, the data of the scanned feet are processed by the Software, with the possibility of performing the following operations:

•  Creation of 2D charts and filters
•  Display of statistics
•  Partition of the users’ data
•  Creation of 3D diagrams

RS-FEETMEASURES

Currently, the size systems do not take into account the geographical differences, offering shoes that can adapt to any type of foot but are not optimized for anyone. Our RS-Feet Measures software is born to face the problem, allowing the analysis of the measures and characteristics of the human foot, in relation to geographical and demographic parameters.

Currently, the size systems do not take into account the geographical differences, offering shoes that can adapt to any type of foot but are not optimized for anyone. Our RS-Feet Measures software is born to face the problem, allowing the analysis of the measures and characteristics of the human foot, in relation to geographical and demographic parameters.

Despite the place in which the footwear production takes place, every shoe or last cheese factory has the need to manage with absolute certainty the inner volume and the size range the shoes they produce.

With RS-FeetMeasures we make it possible to develop sizes that mirror the morphology of the foot based on the geographical area and ethnicity, allowing the supply chain to get to know and understand the consumers’s feet all over the world and produce shoes that are truly faithful to the collected data.

Our software uses the most advanced automatic self-learning algorithms, constantly updating itself with the increase of data entered by our customers.
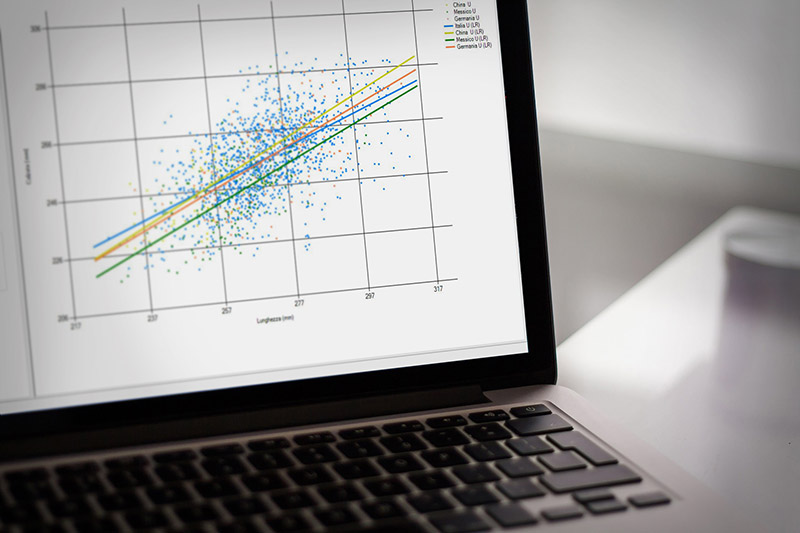
Once downloaded from the RS portal, the data of the scanned feet are processed by the Software, with the possibility of performing the following operations:

•  Creation of 2D charts and filters
•  Display of statistics
•  Partition of the users’ data
•  Creation of 3D diagrams
1
2
3
1

Grid creation to divide users’ data into bands.

2

Creation of 2D charts to determine the right shape development parameters.

3

Display of the slope of the regression line.

RS-FEETMEASURES FUNCTIONS

CREATION OF 2D DIAGRAMS AND FILTERS

Creation of 2D diagrams showing the following feet measurements: Length, Width, Width, Internal tarsal distance, Waist, Shortest instep. The data collected and organized in charts are a useful tool to determine the right development parameters for the reference markets.

DISPLAY OF STATISTICS DATA

• Possibility to display an interval of “confidence” and prediction.
• View of the slope of the regression line.
• Possibility to set the increment of the displayed measure on the X axis to automatically calculate the increment of the displayed measure on the Y axis.

PARTITION OF THE USERS’ DATA

Possibility of creating a grid to divide data into bands (e.g. based on the models development in sizes). Possibility to obtain the percentage calculation of each single cell.

CREATION OF 3D DIAGRAMS

An additional tool that allows to compare the morphologies of different countries on a threedimensional diagram, by setting 3 existing measurements as axes (e.g length, width, fit).

This site is registered on wpml.org as a development site. Switch to a production site key to remove this banner.